About this Guide
The information in this guide will provide a high-level overview of what Cidiscape is and the interface that you will use. More details about how to create Batches, how to create Quick Views, and how to add people to your Team will be described in separate guides linked within this page.
Cidiscape is an administrative and reporting tool developed by Cidi Labs for institutions using the Canvas LMS (Learning Management System). It functions as a central dashboard, providing a “bird’s-eye view” of how other Cidi Labs products—such as the course-design tool DesignPLUS, the accessibility scanner UDOIT, and the cleanup tool *TidyUP—are being used across an institution’s courses. This allows administrators to track meaningful data on tool adoption, monitor accessibility progress, and understand the overall impact of their Cidi Labs software suite.
- *At CCS, TidyUP is not integrated with Canvas. However, Department Chairs, Program Managers, and Instructors can use the Simple Prep Clean Up Tool available within the Simple Prep interface which provides similar functionality.
- Use Case Examples
- Accessing Cidiscape within Canvas
- Cidiscape Welcome Screen
- Cidiscape Dashboard Tab
- Cidiscape Courses Tab
- Cidiscape Reports Tab
Use Case Examples
Click on one of the below accordions to view the use case examples.
Reviewing DesignPLUS Content Issues
When Cidi Labs releases a major update, such as the transition from the “Legacy Sidebar” to the “New DesignPLUS Sidebar”, institutions need to track which content has been migrated and which courses still rely on older tool versions.
How DesignPLUS Versioning Affects Content
Content created with the Legacy Sidebar often has subtle differences in underlying HTML/CSS compared to content created with the New DesignPLUS Sidebar. An institution’s goal is to ensure all active courses are using the new tool for consistency, better features, and streamlined maintenance.
What Cidiscape Shows on the Dashboard
Cidiscape is explicitly designed to track this transition, providing clear metrics for the entire migration process:
- New vs. Legacy Content Metric: The dashboard provides a critical comparative metric: the total number of content pages built using the New DesignPLUS Sidebar versus those using the Legacy Sidebar. This allows administrators to see the current state of adoption at a glance.
- Legacy Course Flag: Cidiscape can flag an entire course if a significant percentage of its DesignPLUS content was created using the Legacy tools. This creates a focused “Migration Priority List” of courses that need intervention or to be targeted for an automated content upgrade script (if available).
- Power User Identification: By tracking which individual faculty members or sub-accounts have the highest percentage of content built with the New Sidebar, the institution can identify internal champions who can assist with peer training and mentoring.
- Content Modification Tracking: After training sessions on the new sidebar, Cidiscape can track the rate at which Legacy content is being modified and subsequently marked as New Sidebar content. This provides a direct measure of training effectiveness and ongoing content maintenance.
This reporting allows the Instructional Technology team to manage the complexity of a major software transition, ensuring a smooth and targeted migration to the latest tools and standards for the entire institution.
Reviewing UDOIT Accessibility Issues
Imagine a fictional university has an initiative to ensure all digital materials are accessible to students with disabilities. They use the Cidi Labs UDOIT tool to scan Canvas courses for accessibility issues.
An administrator (or in the case of CCS, Department Chair and/or Program Manager) can use Cidiscape to get a high-level report on this accessibility initiative across the entire campus.
The Cidiscape dashboard would allow them to:
- See an aggregate report of all accessibility errors found by UDOIT, such as the total number of images missing “alt text” or the number of documents with low color contrast.
- Identify which specific courses or departments have the highest number of accessibility issues that need to be fixed.
- Track progress over time by monitoring if the total number of “unfixed” errors is decreasing as instructors use UDOIT to make corrections.
In this case, Cidiscape acts as the central command center for their accessibility efforts, helping them understand and identify accessibility concerns so that a plan can be developed on how to address those issues in the Canvas course.
Accessing Cidiscape within Canvas
- Log in to your Canvas account via the CCS Access Manager.
- From the Canvas Dashboard, click on the Admin icon on the left-hand global navigation menu.
- From the slide-out menu that appears on the left side of your screen, select a sub-account (Example: FILM, LIBERAL ARTS, TRANSPORTATION DESIGN, etc.)
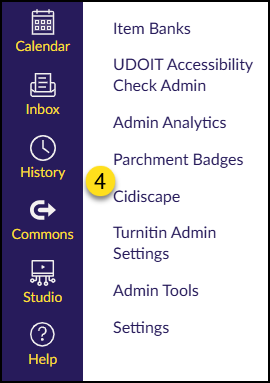
- Find and click on the Cidiscape link on the left side of your screen.
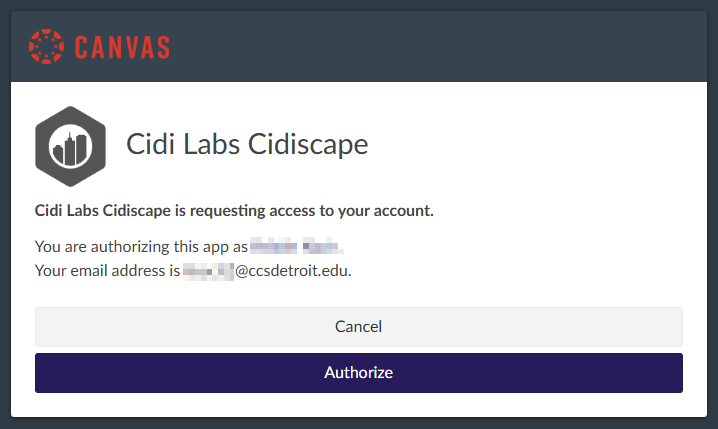
If this is your first time accessing Cidiscape, you will see a screen asking you to authorize your account. Click the Authorize button to continue.
Cidiscape Welcome Screen
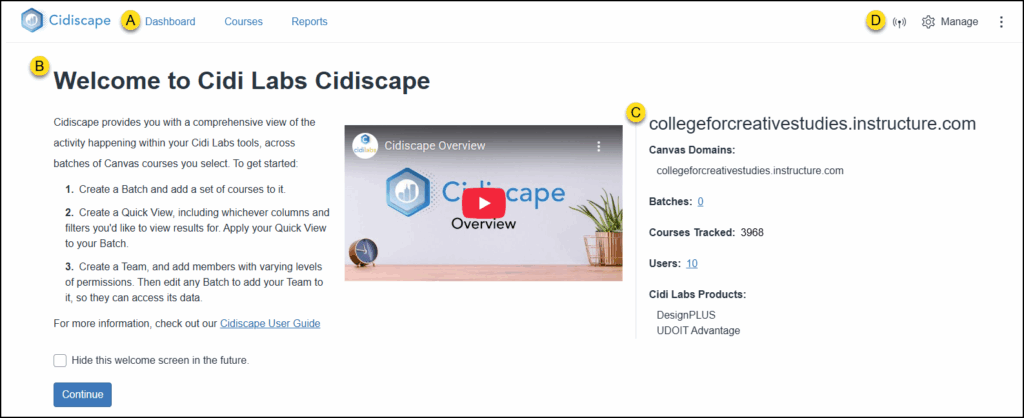
The first screen you may see when you access Cidiscape is a Welcome screen. Refer to the yellow labeled letters in the below screenshot as you read the following descriptions:
- The top menu includes links to the Cidiscape Dashboard, Courses, and Reports. Clicking on the Cidiscape logo returns you to the Welcome screen.
- The Welcome to Cidi Labs Cidiscape section includes a brief overview of how to get started, a short 4 1/2 minute overview video, and a checkbox option to Hide this welcome screen in the future.
- This section includes general information about CCS’ Canvas Domains, the number of Batches, total Courses Tracked, total Users in Cidiscape, and a list of the Cidi Labs Products that CCS uses.
- This section includes icons for Live Events, ⚙️ Manage (an area for Batches, Quick Views, and more), and a three vertical dots icon where you will find Account and Support options.
- The⚙️ Manage link includes (but is not limited to) the following areas:
Cidiscape Dashboard Tab
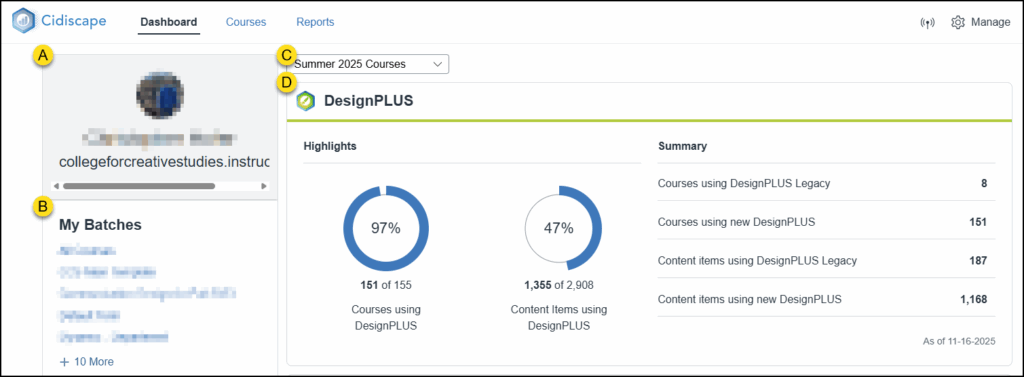
The Cidiscape Dashboard tab includes the following sections (shown below in yellow labeled letters):
- This section displays your Canvas avatar, your name, and the CCS Canvas domain name.
- The My Batches area will include any batches that have been created by the ET+I team or batches that you have created on your own. A link to Manage Batches (not shown) appears below the My Batches area.
- The Select Batches drop-down list allows you to select one or more batches. Data from selected batches will display below the drop-down list. In the below example screenshot, the Summer 2025 Courses batch is selected.
- This section shows data highlights of DesignPLUS, UDOIT (not shown), and UDOIT Issue Type Occurrences (not shown).
Cidiscape Courses Tab
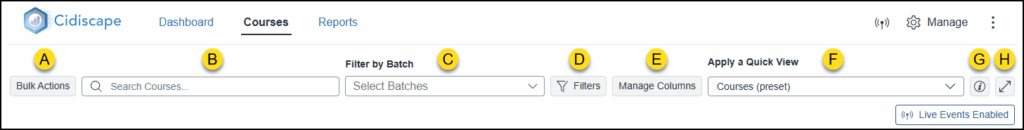
The Cidiscape Courses tab includes a variety of options buttons and drop-down menus. Below these buttons and menus, a table displaying course information is visible. Refer to the yellow labeled letters in the below screenshot as you review these descriptions:
- Bulk Actions: After you place a checkmark in one or more checkboxes on the left-hand side of the table, four options become active: Sync LMS Data for # Courses, Scan # Courses with UDOIT, Sync/Scan # Courses with all tools, and Export to CSV. The # sign will update to reflect an actual value based on the number of checkboxes you select.
- Use the Search Courses… text box to search for things like Course Title, LMS Course ID, or SIS Course ID.
- Use the Filter by Batch drop-down list to select the batch of courses you want to view.
- The Filters button allows you to apply specific filters to your course list to zero in on specific data. You can select from among Canvas, DesignPLUS, and UDOIT filters. And, you can apply mutiple filters to even further narrow down the results you need. (Example: Apply a filter that looks for courses that are published, have more than five students, and have a UDOIT accessibility score of 90% or higher.)
- Use the Manage Columns button to add/remove table columns to suit your needs.
- Note: Not all columns are immediately visible in the table that displays on the Courses tab.
- The Apply a Quick View drop-down list allows you to select or manage Quick Views. Quick Views are saved views that you have created via the Manage Columns button so that you can quickly select them at a later time.
- The Information icon displays a slide-out menu that appears on the right side of the screen displaying Column Definitions. These definitions are arranged in two tabs: Current and All. Current displays any columns currently displayed in your table. All displays all available columns (a green checkmark next to a definition indicates a column is currently in use).
- This button Expands/Contracts the view of the table displayed on the page.
Cidiscape Reports Tab
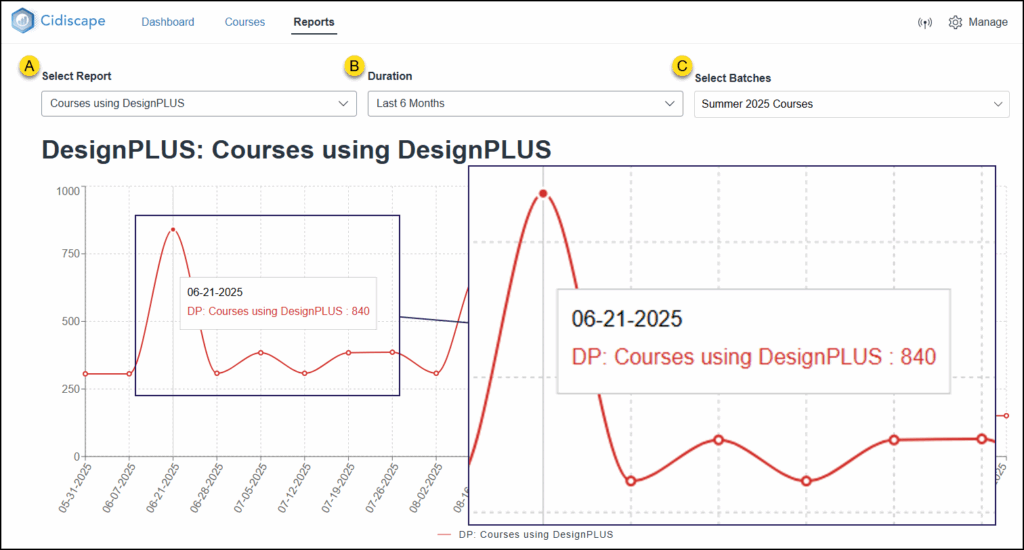
The Cidiscape Reports tab allows you to see data in a graph/chart format. A Data Summary displays below the graph/chart with the same information in a table format. Refer to the yellow labeled letters in the below screenshot as you review these descriptions:
- The Select Report drop-down list contains the following options:
- DesignPLUS: Content Items using DesignPLUS & Courses Using DesignPLUS
- UDOIT: Unweighted Course Score & Issue Count
- The Duration drop-down list includes: Current, Last 30 Days, Last 90 Days, and Last 6 Months.
- The Select Batches drop-down list includes any batches created by you.