
Use the following links to jump to specific areas within this guide:
Early student interaction and feedback is critical to student success, and Canvas has tools that can provide metrics on that interaction within the LMS. For in-person students, this could mean having them check the Syllabus for course expectations and Calendar for semester due dates. In an online course, early and ongoing engagement is vital to building meaningful learning experiences and students’ success. Check out the interactive “Blazing New Trails for Online Engagement” for examples in the online environment.
Below are some of the Canvas tools available to you to view student engagement in Canvas.
Course Analytics
The easiest way to access Couse Analytics is by going to your Home page of a Canvas course and then clicking on the 📊 Course Analytics button on the right side of your screen.
- Alternatively, the Course Analytics course navigation menu can be enabled on the left side of your screen by going to your course Settings >> Navigation tab. Then, drag the Course Analytics button from the bottom (inactive) list to the top (active) list. See Configuring Course Navigation for more information.
Click on each accordion below to learn more about the tabs within Course Analytics.
Course Grade
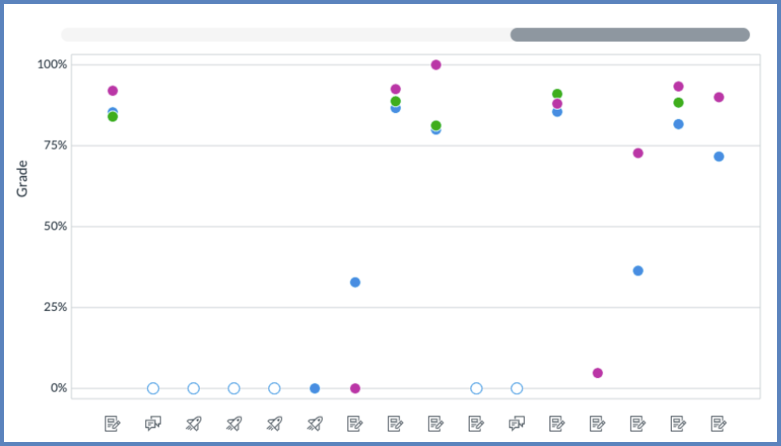
The Course Grade tab will show you the average course grade for various assignments in your course.
Click on any of the dots within the graph to view additional details about the assignment.
Use the “Message Students Who” button to send a message to students who:
- fall within a specific percentage
- have missing work
- have late work
Weekly Online Activity
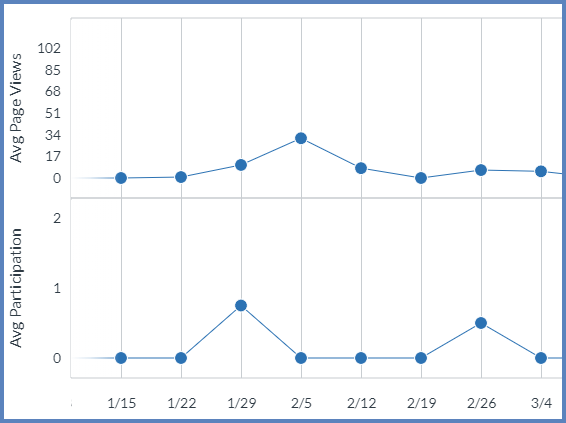
The Weekly Online Activity tab displays average page views, average participation, and a table of resource content in your course (Students, Page Views, and Participations).
Click on any of the dots within the graph to see additional information on page views, participation, and the resources that were viewed.
Use the Message Students Who button to send a message to students who:
- viewed a specific resource
- didn’t view a specific resource
- participated in a specific resource
- didn’t participate in a specific resource
Students
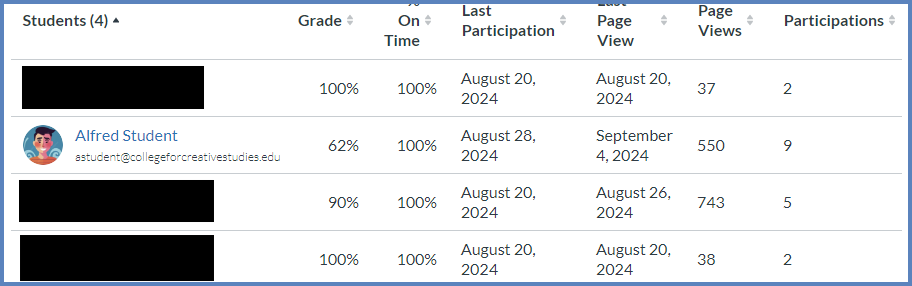
The Students tab will show you a complete listing of all students enrolled in your course. The table also displays:
- a student’s current course grade
- percentage of assignments submitted on time or before a due date
- the date when a student last interacted with the course
- the date when a user last accessed the course
- the count of total page views for a student within the course
- the count of total participations for a student within the course
On this screen, the same options are available for Message Students Who that are available on the Course Grade tab.
Reports
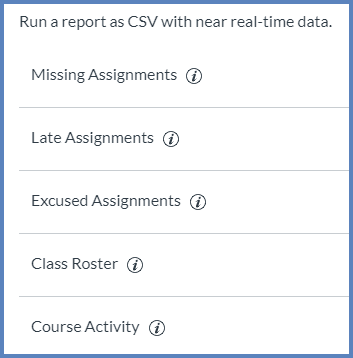
The Reports tab offers five reports that can be run from this screen. Click on the ℹ️ information icon next to each name to see an example.
- Missing Assignments: This report will produce a list of assignments that have not been submitted yet.
- Late Assignments: This report will produce a list of assignments that have been submitted late.
- Excused Assignments: This report will produce a list of assignments that are excused.
- Class Roster: This report will produce a list of students enrolled in the course or section with student contact information such as email, SIS ID, etc.
- Course Activity: The report provides a list of daily user interactions in course resources, where each report entry captures a summary of user views and participations. Account time zone is applied to facilitate daily views and participation aggregates. Calendar filter only accommodates for 30 days in the past.
After running the report, you can download a CSV file to your computer to look at the data.
Online Attendance
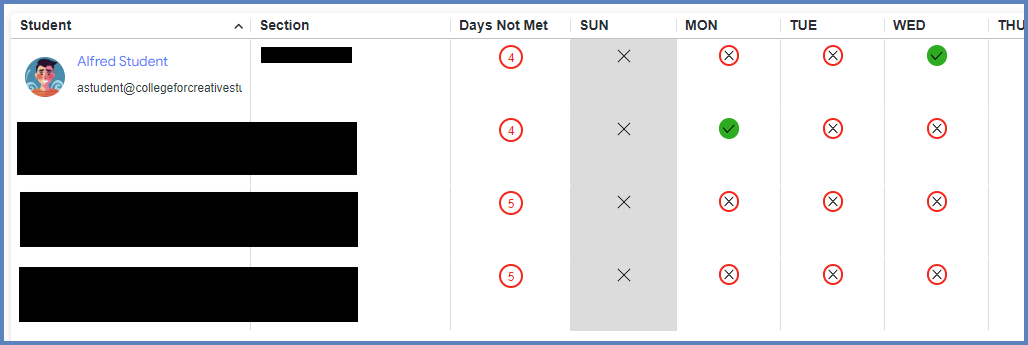
The Online Attendance report helps instructors identify students who may be disengaged or falling behind based on customizable engagement criteria. Criteria include:
- Course Access: student views a page in a course
- Posts: student posts a new comment to an announcement or a discussion
- Assignments: student submits an assignment
- Collaborations: student loads a collaboration to view/edit document
- Conferences: student joins a web conference
- Pages: student creates a page
- Quizzes: student starts taking or submits a classic quiz or submits a classic quiz
If a student meets the requirements of any selected criteria, he/she will be marked as present for that day in the Online Attendance report.