CCS uses the Watermark Course Evaluation & Surveys tool within the Canvas LMS (Learning Management System) to distribute end-of-semester course evaluations to students. Instructors can follow the below steps to access course evaluations directly within Canvas.
- Navigate to Course Evaluations
- Watermark Course Evaluations & Surveys Dashboard
- Project Results (Access Course Evaluations)
- Batch Report
- Troubleshooting
- Additional Resources
Navigate to Course Evaluations
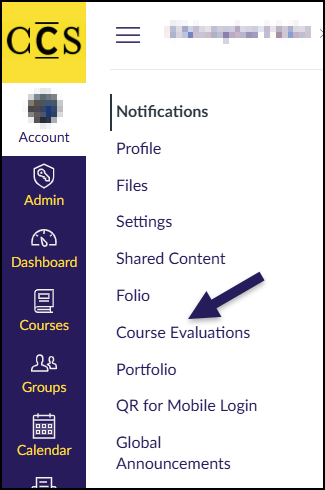
In Canvas, click on the Account icon in the far left-hand global navigation menu.
In the slide-out menu that appears, select one of the following: Notifications, Profile, Settings, or Shared Content.
After a few seconds, the Course Evaluations link will appear on the left side of your screen. Click on this link to access the Watermark Course Evaluations & Surveys interface.
- A number may appear directly to the right of the Course Evaluation link indicating the number of current evaluations to be viewed.
Watermark Course Evaluations & Surveys Dashboard
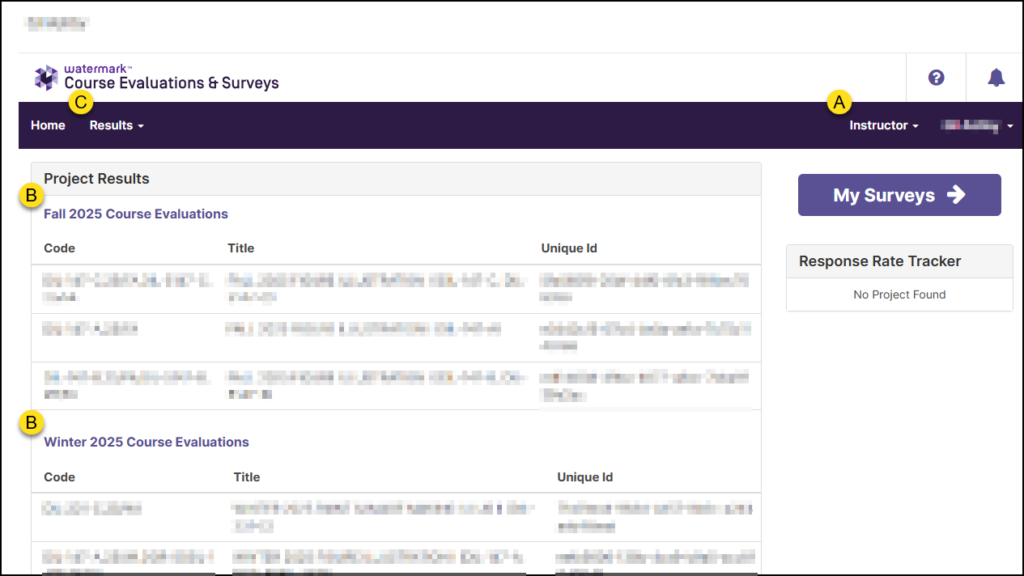
Your Watermark Course Evaluations & Surveys dashboard will look similar to the below screenshot.
- Ensure that Instructor is listed from the drop-down list.
- If Student/Respondent or CES Administrator is shown, select Instructor from the drop-down list.
- Select a project name from beneath the Project Results heading. The course Code, Title, and Unique Id for each of your courses within a given project will display.
- To locate additional past survey project results, click on the Results drop-down list, and select Project Results.
Project Results
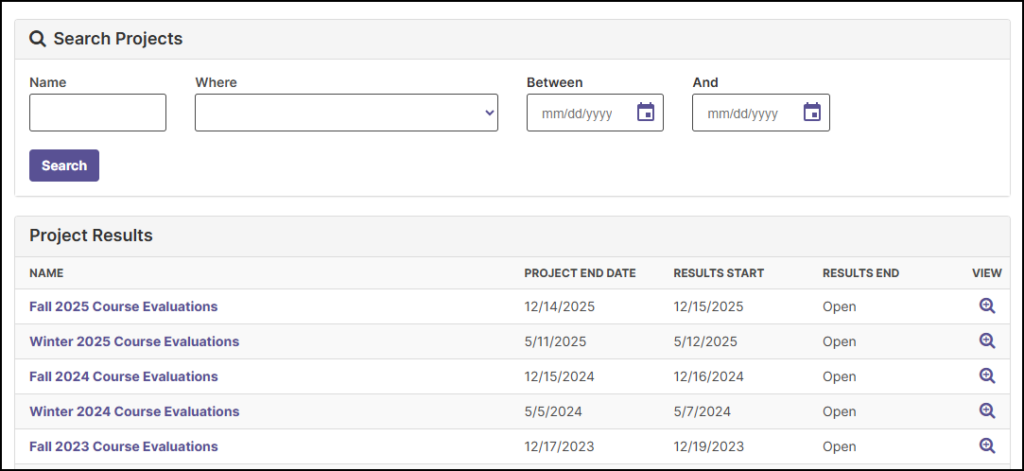
If you select Results >> Project Results, a screen similar to the below screenshot will display. Click on the name of a project, or click on the 🔍 magnifying glass icon under the VIEW column to view courses within that semester project.
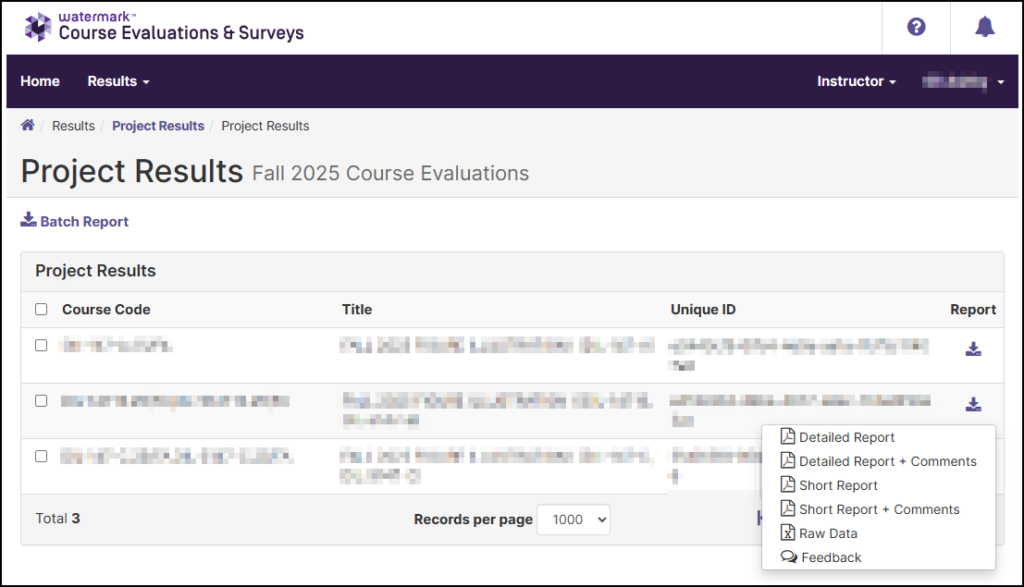
After clicking on a survey project name, a screen similar to the below screenshot will display showing the Course Code, course Title, and Unique ID. Beneath the Report column, click on the Download Report for [course name] icon. The available reports are:
- Detailed Report: A quantitative report without write-in comments in PDF format.
- Detailed Report + Comments: A quantitative report including write-in comments in PDF format.
- Short Report: A condensed, quantitative report without write-in questions in PDF format.
- Short Report + Comments: A condensed, quantitative report including write-in comments in PDF format.
- Raw Data: Provides detailed evaluation data in a spreadsheet format.
- Feedback: If you use the Results Feedback feature, you can run this report to review any system dialogue between instructors and administrators about course evaluation results.
Batch Report
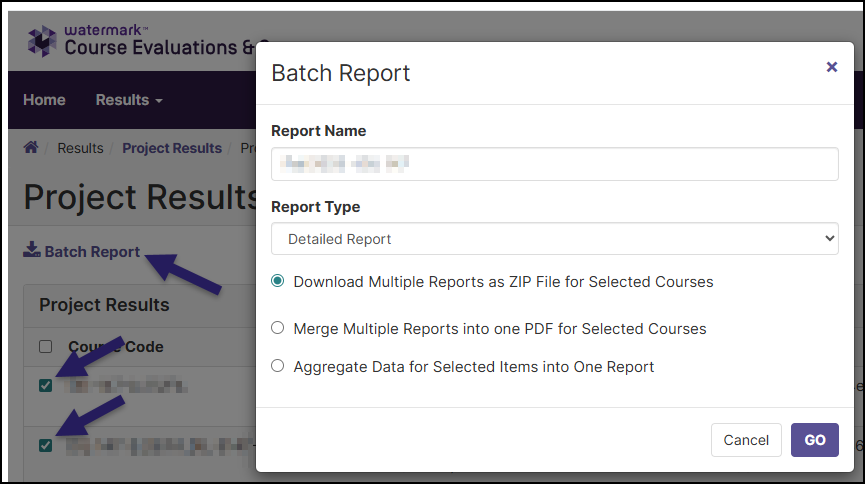
If you would like to download reports as a batch, place a ✅ checkmark next to each course name that you’d like to include in the batch, and then click the Batch Report link. The Batch Report pop-up window will display. Give your batch report a Report Name. From the Report Type drop-down list, select one of the available options:
- Detailed Report: A quantitative report without write-in comments in PDF format.
- Detailed Report + Comments: A quantitative report including write-in comments in PDF format.
- Short Report: A condensed, quantitative report without write-in questions in PDF format.
- Short Report + Comments: A condensed, quantitative report including write-in comments in PDF format.
- Raw Data: Provides detailed evaluation data in a spreadsheet format.
Select one of the three radio button options:
- Download Multiple Reports as ZIP File for Selected Courses: Course section reports will be downloaded as individual PDF files into a single ZIP file. Data is not aggregated.
- Merge Multiple Detailed Reports into one PDF for Selected Courses: Individual course section reports will be compiled into a single PDF report. Data is not aggregated.
- Aggregate Data for Selected Items into One Report: Results for all selected course sections will be aggregated into one single PDF report.
Click GO to create the report.
Troubleshooting
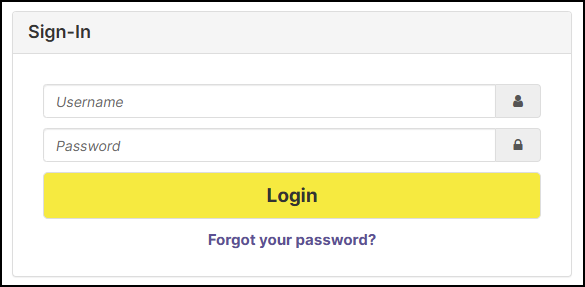
If you encounter a Sign-In screen when trying to access your course evaluation surveys, try clearing your browser history/cache. You may need to fully close your browser and re-login to Canvas after completing either option.
- Option 1: Follow the steps outlined in How do I clear my browser cache and cookies?.
- Option 2: Perform a hard cache reset in your web browser using the keyboard combination Ctrl + Shift + R (Windows/Linux) or Cmd + Shift + R (Mac).
Additional Resources